Is Google Trends data worth the pixels it’s written in?
Google Trends data – even historical data – seems to change every time you look at it.
In mid-January we used Google Trends data to research where searching for “Shropshire” was most popular. It was a surprise to see that, despite Shropshire being an English county, it was a more popular search in Wales. Was Shropshire being forgotten by England?
The data for January to date suggested it was. A historical check through all of 2020’s data confirmed it. But without complete data for January our story was not complete. So we waited until the end of the month.
And then it all changed.
We expected the January data to change when we took a second look. We’d be looking at 31 days instead of 22.
But we weren’t expecting the data for 2020 to change. That was historical. It’s done. It’s fixed. But no, every time we repeated the search the results were different. We did three searches every day for a week. That’s fifteen tests. Not once were the results the same. Not once.
Although searching for “Shropshire” was always most popular in Wales (so it always scores 100 in the Google Trends charts), England, Scotland and Northern Ireland kept moving below it. This was historical data about searches that had already been completed. It shouldn’t change.
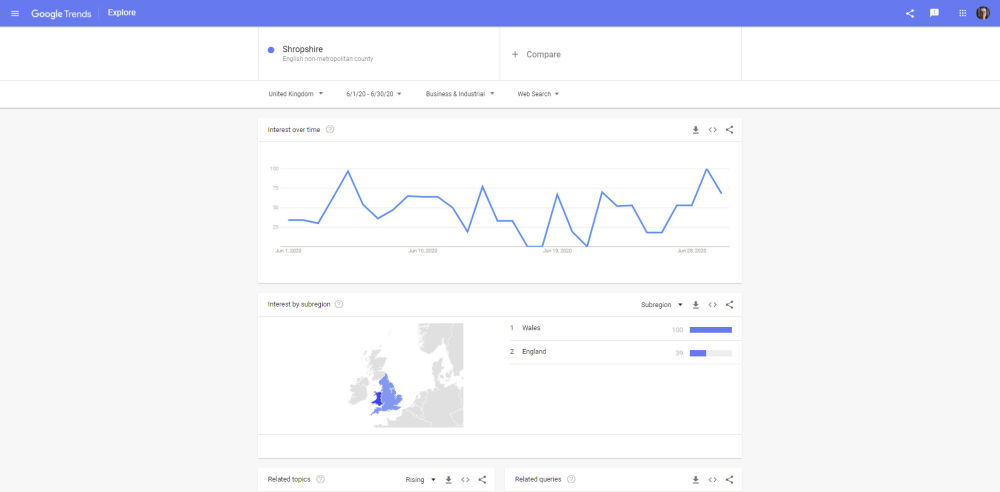
Take a look at these charts. They relate to one category of searches for the county of Shropshire for June 2020.
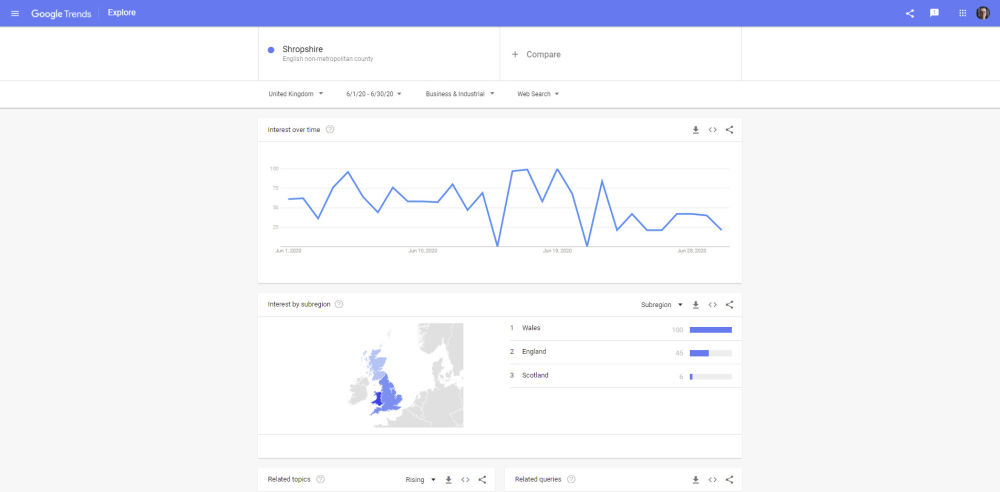
On Monday, Google Trends data reported England as second to Wales and Scotland a distant third.

On Tuesday, England was still reported as second to Wales but the popularity of searches there has dropped and Scotland has disappeared entirely.

On Wednesday, Google Trends data reported popularity of searches in England had dropped again and Northern Ireland has replaced Scotland.
On Thursday, England was reported as trailing Wales solo again.

But by Friday it’s party time. Google Trends data reported England as being closer to Wales and both Scotland and Northern Ireland have joined the chase.
So here’s our request. Can anyone say why this data’s changing? We can’t believe that data from Google is actually wrong. A lot of research is happening using Google Trends data so it can’t be wrong, surely? We’re much more comfortable assuming that we’re misinterpreting it in some way. But because the search is so simple, so easy to replicate and so specific, it’s hard to understand how.
What do Google Trends figures mean?
We need to add a short addendum on what the sub-region figures in Google Trends mean. It’s a bit of a mind-bender.
Take a look at that last illustration, Friday’s figures. Google Trends is not telling us that England generated 51% as many searches for “Shropshire” as Wales. It’s saying that, in England, searches for “Shropshire” were 51% as popular as searches for “Shropshire” in Wales. Is your head spinning yet? Let’s use some fake data to illustrate it:
| Total searches | Searches for “Shropshire” | Proportion | Google Trends Score | |
| England | 10,000,000 | 1,000 | 0.010% | 78 |
| Scotland | 3,500,000 | 450 | 0.013% | 100 |
| Wales | 2,500,000 | 175 | 0.007% | 54 |
| Northern Ireland | 1,250,000 | 100 | 0.008% | 62 |
- Imagine that, on a given day, there were 10,000,000 searches performed in England.
- Imagine that, on that same day, 1,000 of those searches in England were for “Shropshire”.
- That means the proportion of searches in England for “Shropshire” was 0.010%. It’s this proportion that Google Trends uses in its sub-region rankings. It doesn’t look at the actual number of searches in the sub-region.
- On the same day, 0.013% of the searches in Scotland were for “Shropshire”. That’s the highest proportion of any of the four sub-regions. In Google Trends, that means it scores 100.
- The other sub-regions get a score relative to Scotland’s 100. The score reflects the proportion of searches for “Shropshire” in that region.
- On this basis, the ‘ranking’ would go Scotland, England, Northern Ireland, Wales.
- This is totally different to the ranking if we compared total actual searches for “Shropshire”. That would be England, Scotland, Wales, Northern Ireland. But Google Trends doesn’t talk about actual search volumes.
And none of that alters our concern that the data changes.
In summary, yes, Google Trends gives you data but it may not be the type of data you’re used to. If you’re looking for reliable, accessible data start with your own sales data.